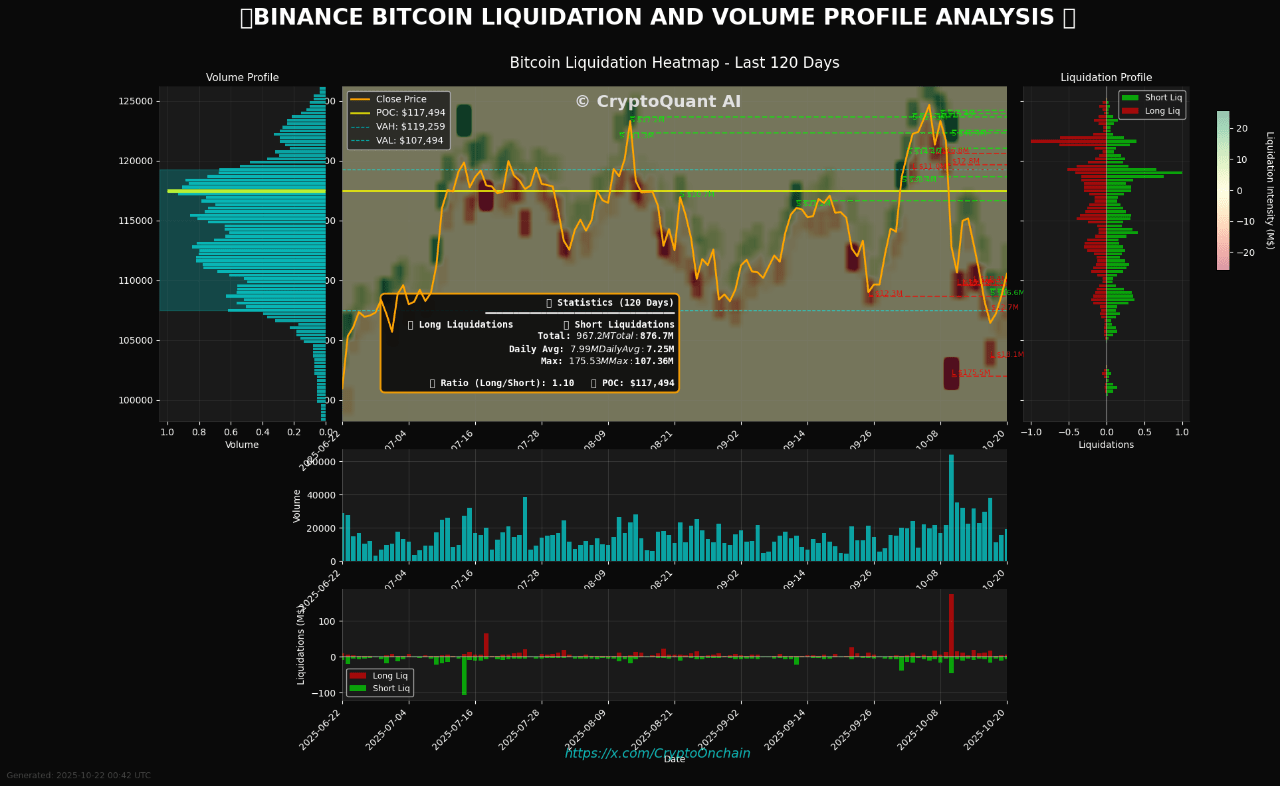
Bitcoin is struggling to establish a clear direction as volatility tightens and traders face increasing uncertainty. After weeks of indecisive movement, short-term price action remains choppy, leaving both bulls and bears without conviction. According to new insights from CryptoQuant, a comprehensive analysis combining Price Action, Volume Profile, and Liquidation Heatmap data from Binance reveals that Bitcoin has been locked in a well-defined trading range for the past 120 days.
The report highlights that this range is centered between $107,500 and $119,300, with the Point of Control (POC) — the level where the most trading volume has occurred — sitting near $117,500. Despite several attempts to break higher, BTC has repeatedly failed to sustain momentum, falling back into this range each time. Analysts suggest this pattern reflects a market in balance, waiting for a catalyst to break decisively in either direction.
Within these boundaries, Bitcoin traders are closely monitoring liquidity clusters and key volume zones to anticipate the next big move. Whether BTC reclaims higher ground or tests lower supports, the breakout from this 120-day range could define the next major phase of the cycle.
Bitcoin Faces a Crucial Test at the Point of Control (POC)
According to CryptoOnchain’s latest analysis on CryptoQuannt, Bitcoin’s recent breakout attempt above its 120-day trading range has failed to gain traction, forming what analysts call a classic “Look Above and Fail” pattern. The move initially triggered a short squeeze that liquidated many sellers on Binance, briefly pushing the price higher. However, the rally quickly lost strength due to insufficient follow-through buying, leading BTC to fall back into its established range — a sign of underlying market weakness.

At present, Bitcoin is hovering just below the critical Point of Control (POC) near $117,500 — the price level where the largest trading volume has occurred. This level now acts as the key battleground for the next major move.
In the bullish scenario, a confirmed breakout above the POC could turn this zone into support and pave the way for a retest of the Value Area High (VAH) around $119,300. Such a move could also trigger short liquidations, driving BTC toward the buy-side liquidity zone sitting above $120,000.
In the bearish scenario, continued rejection from the POC would point toward renewed selling pressure, targeting the Value Area Low (VAL) near $107,500 — where significant stop-losses and long liquidations remain clustered.
Bitcoin Bears Defend the $110K Zone
Bitcoin is once again struggling to reclaim momentum after failing to break through resistance near $111,000. The chart shows that BTC remains trapped below key moving averages, with the 50-day SMA acting as a dynamic ceiling around $112,000 and the 100-day SMA near $114,000 reinforcing bearish pressure. Meanwhile, the 200-day SMA, currently positioned around $107,000, is providing short-term support — a critical line that bulls must defend to avoid deeper losses.

The market structure indicates that BTC continues to trade within a defined range between approximately $107,000 and $117,500. Recent price action has been characterized by failed breakout attempts and sharp pullbacks, highlighting indecision and low conviction among both bulls and bears.
A sustained move above the $111,000–$112,000 zone could open the path for a test of $117,500, which has repeatedly acted as a major resistance level since August. However, a breakdown below $107,000 would likely accelerate selling pressure toward the $103,000 area — the flash-crash low from earlier this month.
For now, Bitcoin remains in consolidation, with market participants awaiting a decisive breakout to confirm whether the next major move will be a bullish reversal or a continuation of the current downtrend.
Featured image from ChatGPT, chart from TradingView.com


