Bitcoin’s listless tape in the face of roaring macro risk is less a contradiction than a timing problem, argues this week’s edition of The Weekly Insight (Week 160, Sept. 20, 2025). Writing under the banner “Why’s BTC Lagging?”, contributor @CryptoinsightUK sets a decisively constructive medium-term tone—“I want to start this week by saying I am bullish, and I will continue to be bullish until I believe we are close to a top”—while acknowledging that the market feels late-cycle and emotionally frayed. “With that said, I do think we are closer to a top than a low here,” he adds, but the author still believes “we are approaching the most euphoric stage of this bull cycle.”
Why Is Bitcoin Lagging?
The piece pins much of today’s malaise on sentiment reflexivity. Crypto-Twitter’s grinding negativity is described as a view-generating feedback loop that makes the market feel heavier than it is. “That lag can feel frustrating,” the author writes, noting that the Fear & Greed Index has not displayed the clustered “extreme greed” readings that characterized the 2021 double-top.
Aside from a burst of exuberance around late-2024/early-2025—“which coincided with XRP’s rally from around 50 cents to $2.70, eventually topping out at about $3.30 to $3.40”—the index has hovered in the mid-range, far from the blow-off conditions that typically mark cycle peaks. The implication is straightforward: despite the noise, the market has yet to show the classic euphoria clusters that precede tops.
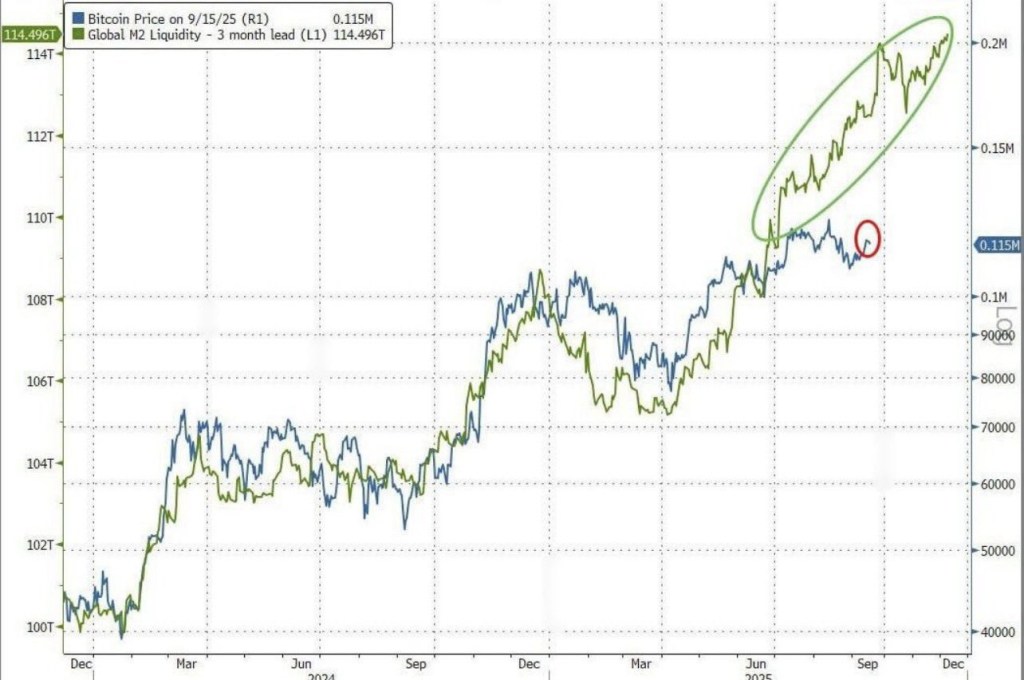
Macro correlations, often invoked to explain Bitcoin’s leadership or underperformance, are used here to argue for lag rather than breakdown. On M2 money supply, the author reiterates a well-tracked three-month linkage: “Bitcoin and the M2 money supply have correlated closely so far, but in the last two to three months M2 has absolutely ripped higher.” From here, readers can “either argue that the correlation has broken down, or that Bitcoin is simply lagging and has yet to catch up.”
A similar read extends to gold. Directional leadership has alternated between the two assets, but with bullion pressing higher, a catch-up in BTC would “imply a move towards at least $135,000, compared to the current level of around $115,000.” Equities tell the same story in another register: the Nasdaq, Dow Jones, S&P, and Russell 2000 are at or near fresh all-time highs while Bitcoin has “mostly chopped sideways,” again “looking as though it may be lagging behind.”
Market microstructure adds a decisive layer. The letter emphasizes the interaction between visible liquidity pockets and consolidation dynamics. “Every single time there has been a significant liquidity build up, Bitcoin has eventually run through it.” As price has stepped higher, resting liquidity has thickened—“red indicates the deepest liquidity, orange the next, and green the lightest”—and breakouts have been most forceful once those deep pockets were taken.
The example given is the “run from $70k to $100k,” where “heavy consolidation was followed by an explosive breakout.” By that logic, the current map “is pointing to a move toward $140k or higher,” which also dovetails with the gold-parity argument. The author’s metaphor is telling: “I often explain price action like stored energy. The longer it consolidates and charges, the bigger the eventual release.”
What Role Do Altcoins Play?
The most forceful claim in the issue is not about Bitcoin at all but about altcoins. Both Total2 (crypto ex-BTC) and Total3 (crypto ex-BTC and ETH) are said to have “closed a daily candle into price discovery.” Total2 “closed a weekly all time high and is now extremely close to closing a second consecutive weekly high,” while Total3 sits “right on the edge of breaking into new all-time highs.”
Structurally, the report frames Total2 as completing a Wyckoff accumulation and cup-and-handle, and Total3 as carving an ascending triangle poised for continuation. The combination—alts pressing price discovery while Bitcoin “is preparing to push to new highs”—is the setup the author associates with “mania or euphoria.” It is also the basis for a clear positioning disclosure: “it is exactly why I am fully positioned in altcoins here.”
That rotation view is bolstered by a call on Bitcoin dominance. The author reiterates a long-held target: “I think we are heading down to at least the 35.5 percent level, and potentially even into the low 20s.” The historical analogs are unambiguous: from the 2017 highs, dominance “dropped by 62 percent,” and from the 2021 highs it “dropped by 46 percent,” each time accompanied by an acceleration in the monthly decline.
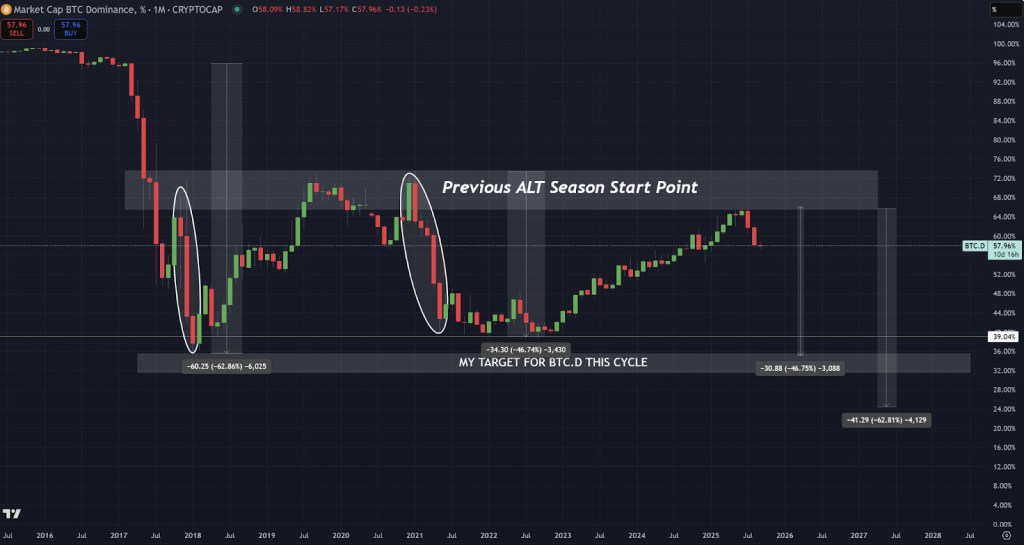
If a similar acceleration coincides with BTC “ripping to new all time highs,” the result would be “a face melting altcoin rally that most people cannot even imagine right now.” The letter links this purely market-internal setup with external catalysts, citing “major legislative shifts in the largest financial economy in the world” and “the potential influx of trillions of dollars through stablecoins and the Clarity Act, which could be passed as soon as November.”
Where Is Bitcoin Price Heading Next?
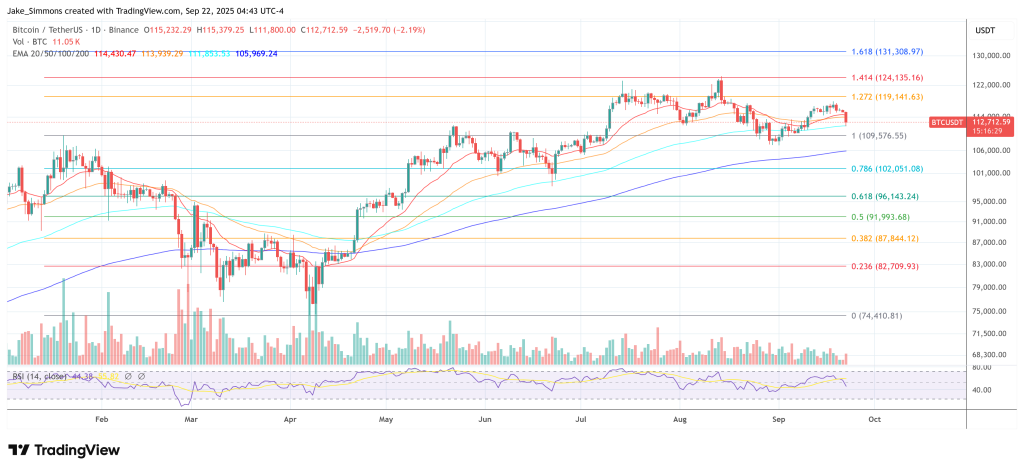
The issue closes with a complementary technical brief by @thecryptomann1 that brings the near-term risk map into focus. For BTC spot, “decision time… is fast approaching,” with the zone between $111,000 and $115,000 flagged as “huge.” Lose it, and “the liquidity around the $105K range feels inevitable.” Exchange-side order-book heatmaps show “a chunk of liquidity sitting here across all exchanges,” suggesting elevated volatility if tested. The analyst doesn’t force a directional call—“I’m unsure which way the market swings”—and labels aggressive speculation “dangerous” in the current chop.

A second lens comes via USDT dominance (USDT.D), which the analyst inverts to track risk appetite. The metric has been “stuck in [a] range for the past 15 months or so,” but structurally “looks like a chart that’s on its way to revisit its highs (which, in reality, are the lows).” The stated target remains 3.76%. The logic is deliberately simple—range structure, a hold of the 0.5 retracement, persistence in trend, and defense of a key “blue box” support—each pointing “to strength,” i.e., room for risk to keep advancing before stablecoin dominance rises again. That underpins a tactical approach: “The way I’m playing it is swinging long until USDT.D hits 3.76%, then de-risking. That’s not financial advice, just the way I’m approaching it.”
The short-term “max pain” path is sketched with characteristic market irony. One plausible sequence is “$BTC pushing up to $120,000, everyone panicking and going long, fueling the liquidity below us, and then sweeping the lows.” The analyst cautions that a straight drop to the “low $100,000 range” feels “too obvious,” but concedes that both upside and downside liquidity are attractors in a compressed-volatility environment. The mood music for traders is summed, wryly, in a single line: “it’s getting squeaky bum time.”
At press time, BTC traded at $112,712.