As Bitcoin (BTC) takes a brief breather after creating a new all-time high (ATH) above $125,000, on-chain data shows that three key indicators played a major role in the digital asset’s latest rally to new highs.
These Three Indicators Suggest More Room For Bitcoin
According to a CryptoQuant Quicktake post by contributor Arab Chain, fresh data from Binance suggests that BTC is witnessing one of its most significant buying phases since mid-year. Notably, BTC’s price has surged from around $117,000 to $124,000 since the beginning of October.
Arab Chain emphasized three key indicators that suggest the return of whales into the Bitcoin market. First, the net buying pressure (vol_delta) surged past $500 million on some days, indicating that buying pressure outweighed selling pressure from this amount.
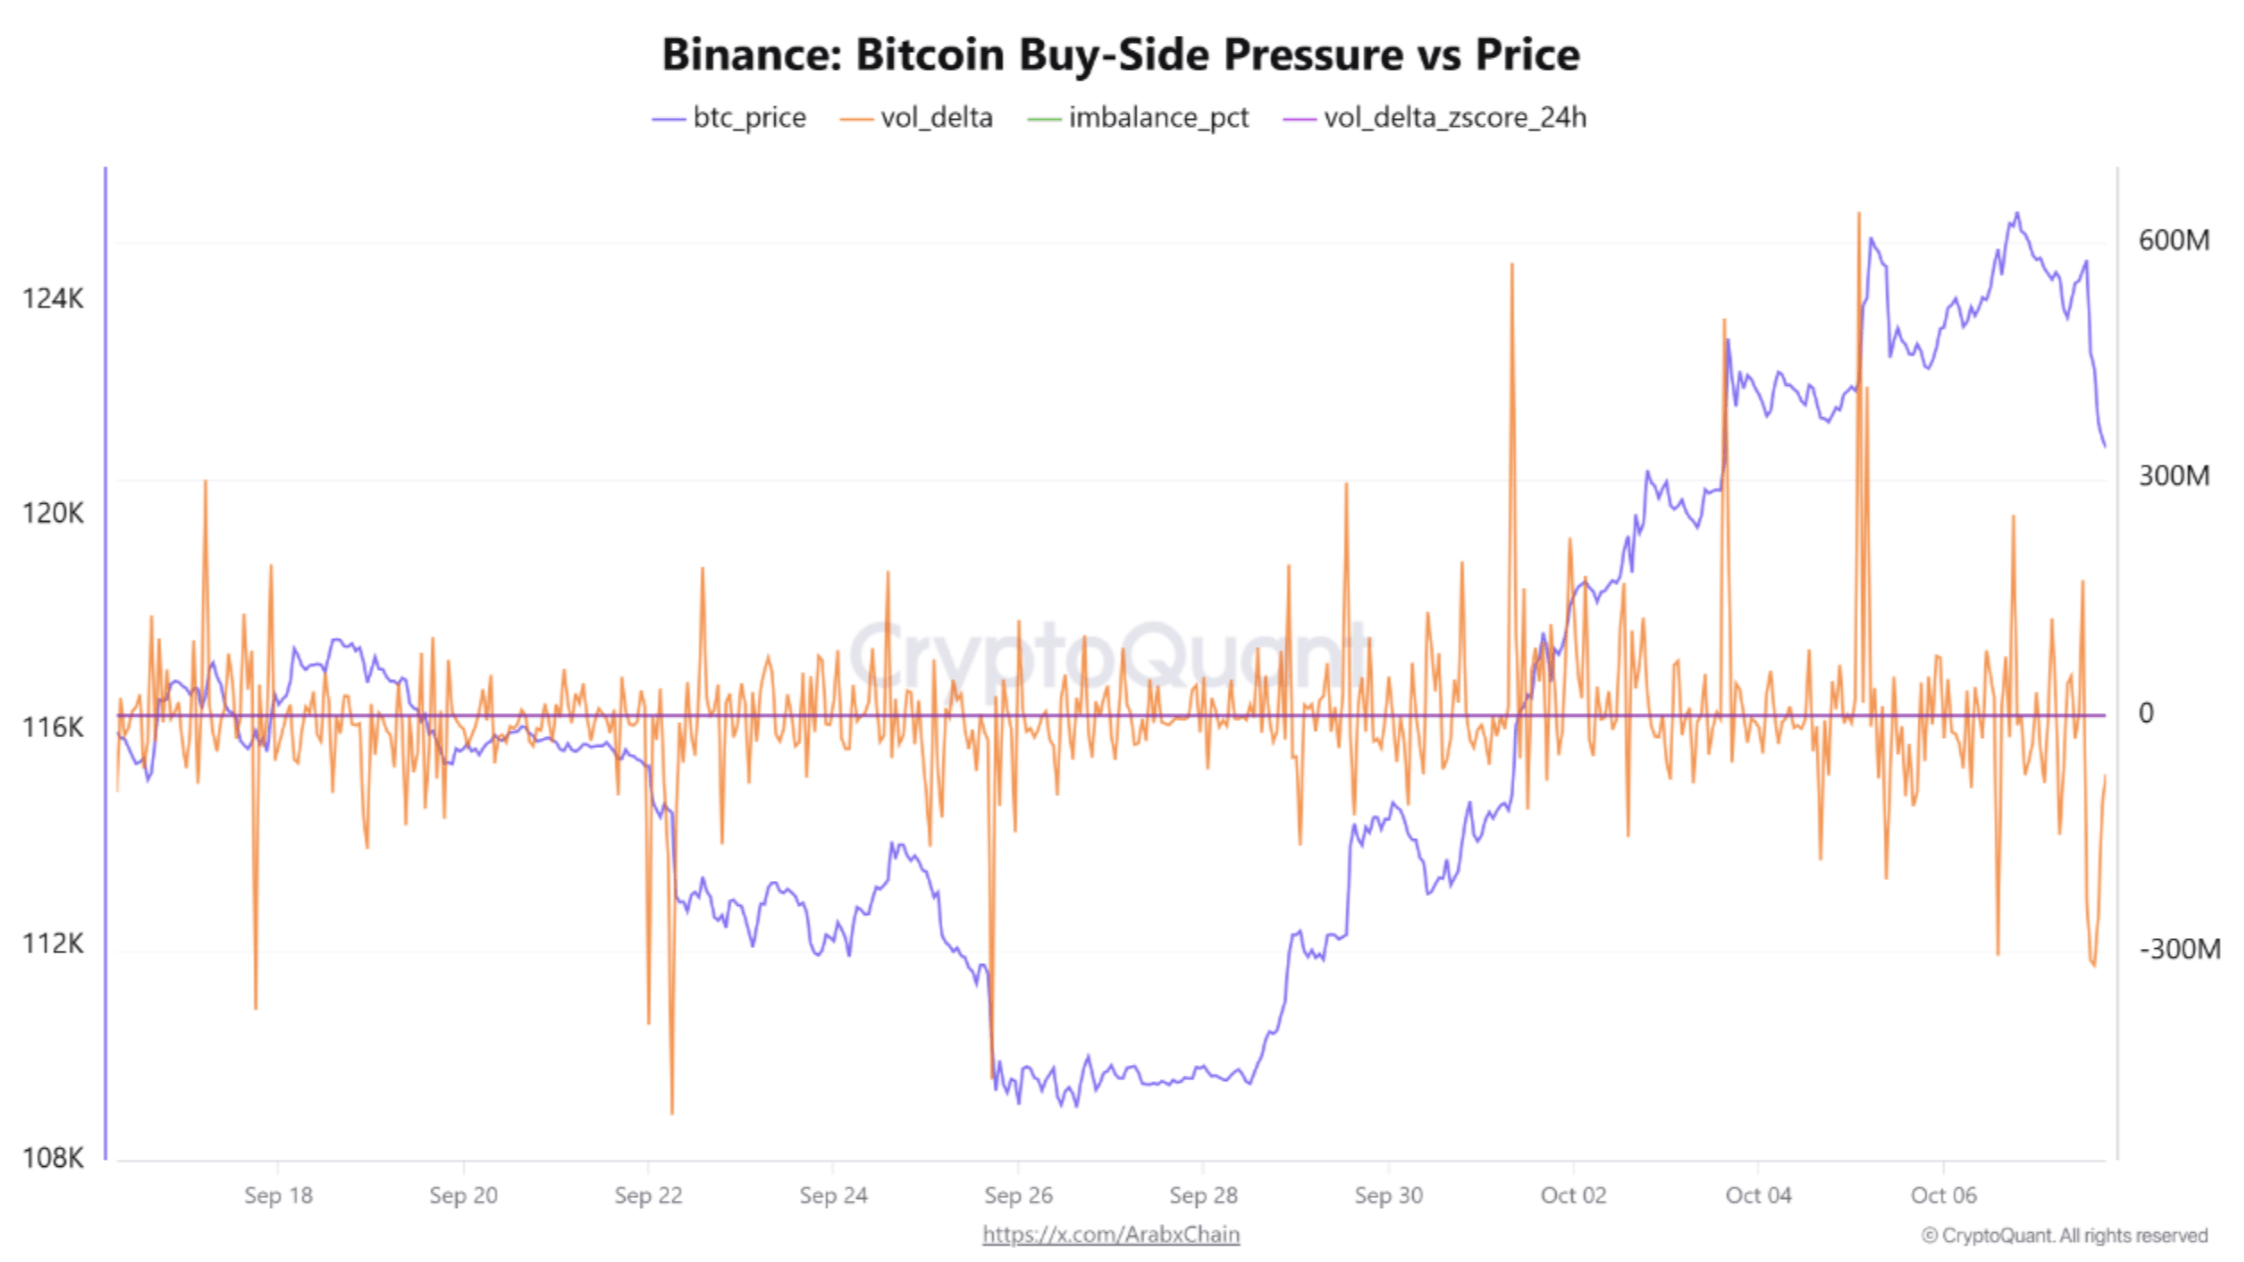
Similarly, the imbalance ratio (imbalance_pct) recently hit a high of 0.23, suggesting that BTC buy orders on Binance were roughly 23% higher than sell orders. Higher buy orders than sell orders usually indicate strong demand and potential upward pressure on the asset’s price.
Finally, the Z-score recorded a value of 0.79, reflecting above-average buying activity. For the uninitiated, a Z-score measures how many standard deviations a data point is from the mean.
The CryptoQuant analyst remarked that these indicators confirm that institutional buyers and whales have returned to the Bitcoin market in force. Arab Chain added:
This activity coincides with a clear increase in daily trading volumes, which have reached their highest levels since last July, suggesting that the rally is being supported by real liquidity rather than temporary speculation.
Recent trading sessions have shown a few of these indicators – especially vol_delta – slightly declining in value, and temporarily moving to negative territory. That said, the broader indicators still favor a continued upward trend for the top cryptocurrency.
Notably, the average daily volatility has remained low, confirming strong market confidence and stable demand. This is in stark contrast to the market behavior shown in September, when BTC was struggling in the $100,000 range.
To conclude, both technical and behavioral indicators support BTC’s continued rise to $125,000 – $130,000 in the near term. Unless a strong wave of sell-off emerges, any price correction should be viewed as an opportunity to accumulate BTC, Arab Chain noted.
What’s Next For BTC?
While it is typically a challenge to predict BTC’s future, some analysts are not shying away from giving predictions about the flagship digital asset’s upcoming price trajectory. For instance, BTC’s pricing bands suggest a move toward $140,000 is likely.
Similarly, rapidly dwindling BTC reserves on crypto exchanges may propel the cryptocurrency’s price to even greater highs, potentially to $150,000 and beyond. At press time, BTC trades at $122,373, up 0.3% in the past 24 hours.