Dogecoin may be gearing up for its next breakout. After holding firm near $0.17 on the weekly chart, DOGE recently bounced off key Fibonacci and trendline support, hinting at renewed bullish potential.
With its 200‑week moving average offering steady support and price comfortably above the ascending channel, technicals suggest the setup is aligning. If the recent dip toward the 200 MA on the M15 chart proves to be a low-risk entry, this could set the stage for a retest of the $0.16490 resistance, and possibly more.
Rejection At Resistance, But Technicals Still Favor Bulls
In a recent analysis shared on X, Thomas Anderson presented a detailed breakdown of DOGE/USD price action across the M15 and M30 timeframes. According to the expert, Dogecoin is currently trading at $0.17043, and the price is facing rejection at the yellow horizontal resistance line around $0.16490. The price action shows consolidation just below this key level, signaling indecision among traders.
Anderson pointed out that the 200 MA (red line) is acting as dynamic support from below, helping to anchor the price during the current consolidation phase. This moving average support provides bulls the foundation to regain control if momentum shifts in their favor.
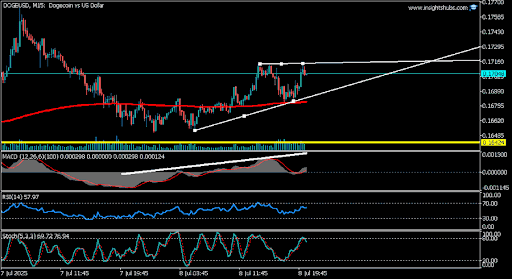
On the M30 chart, Anderson noted that the broader bullish structure remains intact, with DOGE price holding above the ascending trendline. This technical pattern suggests continued optimism for upward movement, provided the price does not break below key support areas. Thomas Anderson concluded that any pullback toward the 200 MA on the M15 timeframe could offer a buying opportunity, particularly for traders eyeing a retest of the $0.16490 resistance.
Dogecoin Weekly Chart Echoes Elliott Theory’s Bullish Blueprint
Taking a closer look at Dogecoin’s weekly chart, crypto analyst Andrew observed a notable long-term wave structure unfolding. He explained that over the past three years, DOGE has completed a five-wave impulse to the upside, which was followed by a typical ABC correction, consistent with Elliott Wave theory.
Andrew further noted that price found a strong reaction at the 0.786 Fibonacci level, marked by a light blue line, which traces the retracement from the entire upward move. This reaction suggests that DOGE may have reached a critical support area, where buyers could begin stepping in.
With this in mind, Andrew believes the current structure appears to be forming a larger 1-2 setup, which could lead to a powerful Wave 3 advance. If this pattern plays out, it may signal the start of a new bullish phase with the potential to break beyond previous highs.