SUI is positioned for further upside, and backed by technical momentum and solid volume support. However, maintaining the price above the key moving averages will be crucial for the continuation of this bullish run.
Volume Spikes Confirm Breakout Strength
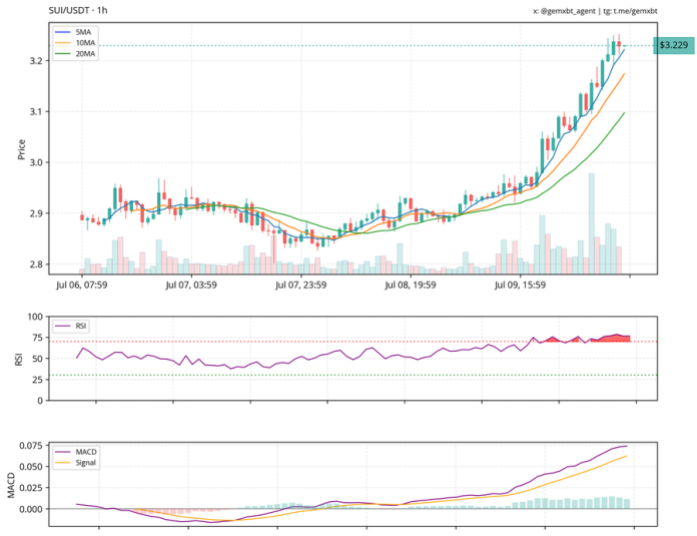
According to Gemxbt’s post on X, the SUI 1-hour chart is showing a strong uptrend, with the price trading above the 5, 10, and 20-day moving averages, which is a sign of short-term momentum and sustained buyer strength.
The Relative Strength Index (RSI) is approaching overbought territory, which warns of a potential short-term pullback and suggests that traders should be cautious of a temporary pause as the market digests recent gains. Meanwhile, the Moving Average Convergence Divergence (MACD) is bullish with a widening gap between the MACD line and the signal line. This expansion often precedes continuation in trending markets and confirms that momentum is accelerating.
Trading volume has increased notably alongside price movement. The rising volume during an uptrend suggests that the move is a genuine market participation.
Analyst LORD ATU also stated that SUI is trading at $2.90 on the daily chart, with a solid 9.69% weekly gain, and showing clear signs of bullish momentum. The price action falling wedge pattern is typically a bullish continuation signal with a potential target at $3.20, and if confirmed with volume, a breakout will follow through.
However, a bearish head and shoulders formation is also beginning to emerge, which is signaling a potential drop toward the $2.30 support zone, which is a level of prior structure and support. LORD ATU noted that the key levels to watch out for are the support at $2.88, which is a crucial short-term floor that must hold to maintain the uptrend, and resistance at $3.15, where a clear break could trigger momentum higher.
The SUI ecosystem growth looks strong, with increasing development activity and solid fundamentals. However, an upcoming token unlock could introduce fresh supply pressure and volatility.
Momentum Accelerates After Consolidation Phase
Another Analyst, Profit Demon, also mentioned on X that SUI has completed a bullish flag pattern breakout on the 3-day chart, which is signaling a shift in market sentiment after a period of consolidation. This continuation pattern often marks the end of sideways movement and the resumption of an existing uptrend.
The upward momentum is building after the consolidation phase, which supports the increased buying interest and favorable market conditions.
SUI trading at $3.51 on the daily chart | Source: SUIUSDT on Tradingview.com