Ethereum price started a recovery wave from the $1,750 zone. ETH is now consolidating and facing hurdles near the $1,920 resistance.
- Ethereum started a recovery wave above the $1,850 level.
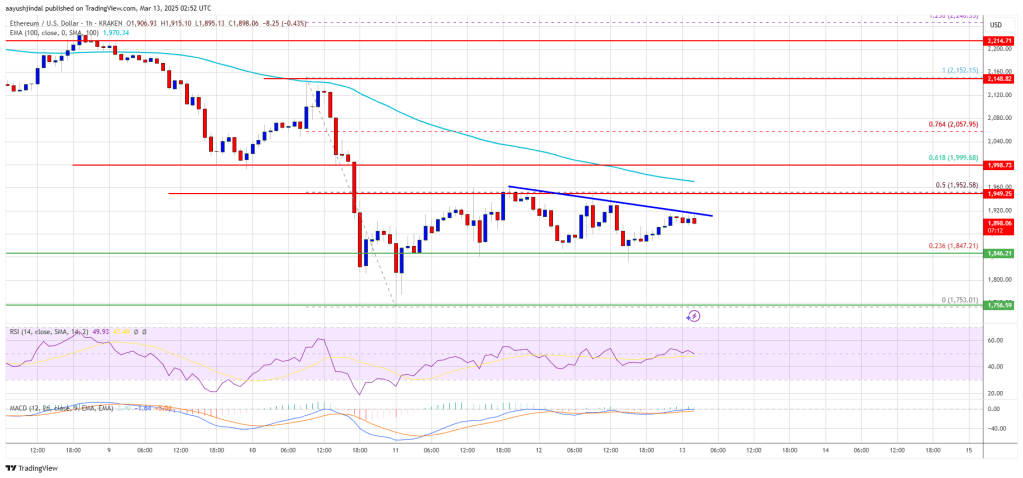
- The price is trading below $1,950 and the 100-hourly Simple Moving Average.
- There is a short-term bearish trend line forming with resistance at $1,920 on the hourly chart of ETH/USD (data feed via Kraken).
- The pair must clear the $1,920 and $1,950 resistance levels to start a decent increase.
Ethereum Price Faces Hurdles
Ethereum price formed a base above the $1,750 level and started a recovery wave, like Bitcoin. ETH was able to clear the $1,800 and $1,820 resistance levels.
The bulls pushed the price above the $1,880 level. There was a move above the 23.6% Fib retracement level of the downward wave from the $2,150 swing high to the $1,752 low. However, the bears seem to be active near the $1,920 resistance zone.
Ethereum price is now trading below $1,950 and the 100-hourly Simple Moving Average. On the upside, the price seems to be facing hurdles near the $1,920 level.
There is also a short-term bearish trend line forming with resistance at $1,920 on the hourly chart of ETH/USD. The next key resistance is near the $1,950 level or the 50% Fib retracement level of the downward wave from the $2,150 swing high to the $1,752 low.

The first major resistance is near the $2,000 level. A clear move above the $2,000 resistance might send the price toward the $2,060 resistance. An upside break above the $2,060 resistance might call for more gains in the coming sessions. In the stated case, Ether could rise toward the $2,120 resistance zone or even $2,250 in the near term.
Another Decline In ETH?
If Ethereum fails to clear the $1,920 resistance, it could start another decline. Initial support on the downside is near the $1,850 level. The first major support sits near the $1,800 zone.
A clear move below the $1,800 support might push the price toward the $1,750 support. Any more losses might send the price toward the $1,720 support level in the near term. The next key support sits at $1,650.
Technical Indicators
Hourly MACD – The MACD for ETH/USD is losing momentum in the bearish zone.
Hourly RSI – The RSI for ETH/USD is now above the 50 zone.
Major Support Level – $1,800
Major Resistance Level – $1,920